Is rooftop solar actually worth it? Find out with real numbers.
PVVerdict simulates your system hour by hour on PVGIS climate data for your location — with or without a battery, with your time-of-use rates — and gives you the verdict: payback years, savings, self-consumption. Free, in your browser, no account.
Opens with a ready-made example (Rome): explore the numbers, then run the setup for your own location. Two minutes.
Free · Open source · No account · Your data never leaves your browser
Why monthly-average solar calculators can't answer you
Most online calculators work the same way: average annual yield, a rule-of-thumb self-consumption factor, an estimated saving. Three numbers, three problems:
- 1
The sun and your consumption don't overlap on average. Your panels peak at noon; your dishwasher runs at 9 pm. What you actually save depends on how those two curves overlap, hour by hour — a monthly average can't know that.
- 2
The battery is the most expensive decision, and the one nobody models. Thousands of euros, yes or no, decided by how much evening consumption you can really shift. Without simulating charge and discharge for every hour of the year, any answer is an opinion.
- 3
If you're on time-of-use rates, averages fail exactly where the money is. The same self-consumed kWh is worth a different amount depending on when you use it. A single factor can't see that.
PVVerdict simulates all 8,760 hours of your year — PVGIS production for your location, your consumption, your tariff, with and without a battery — and only then delivers the verdict.
Three steps from your roof to the verdict
Your location.
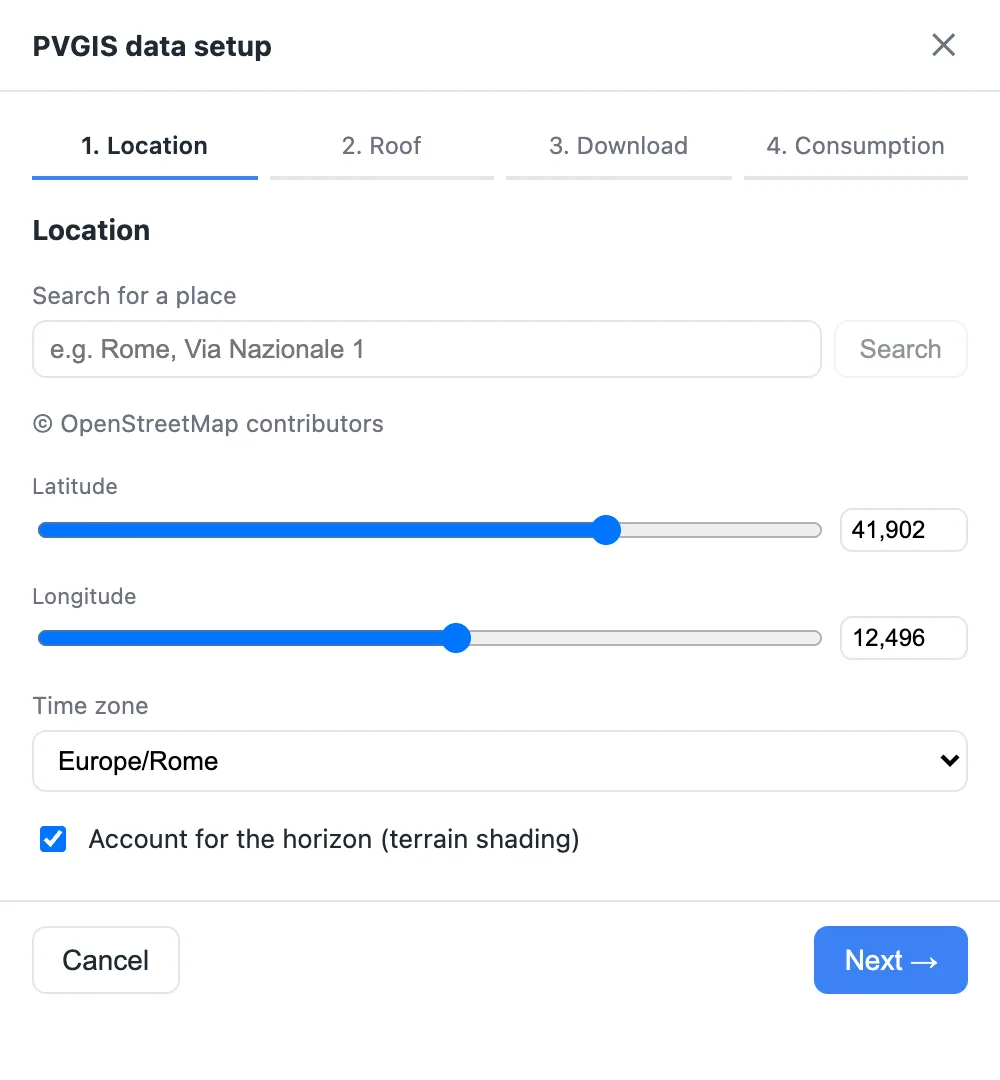
Pick your spot on the map, set roof orientation, tilt and panel power. PVVerdict downloads years of hourly climate data for your area from PVGIS — measured irradiance and temperature, not generic tables.
Your consumption.
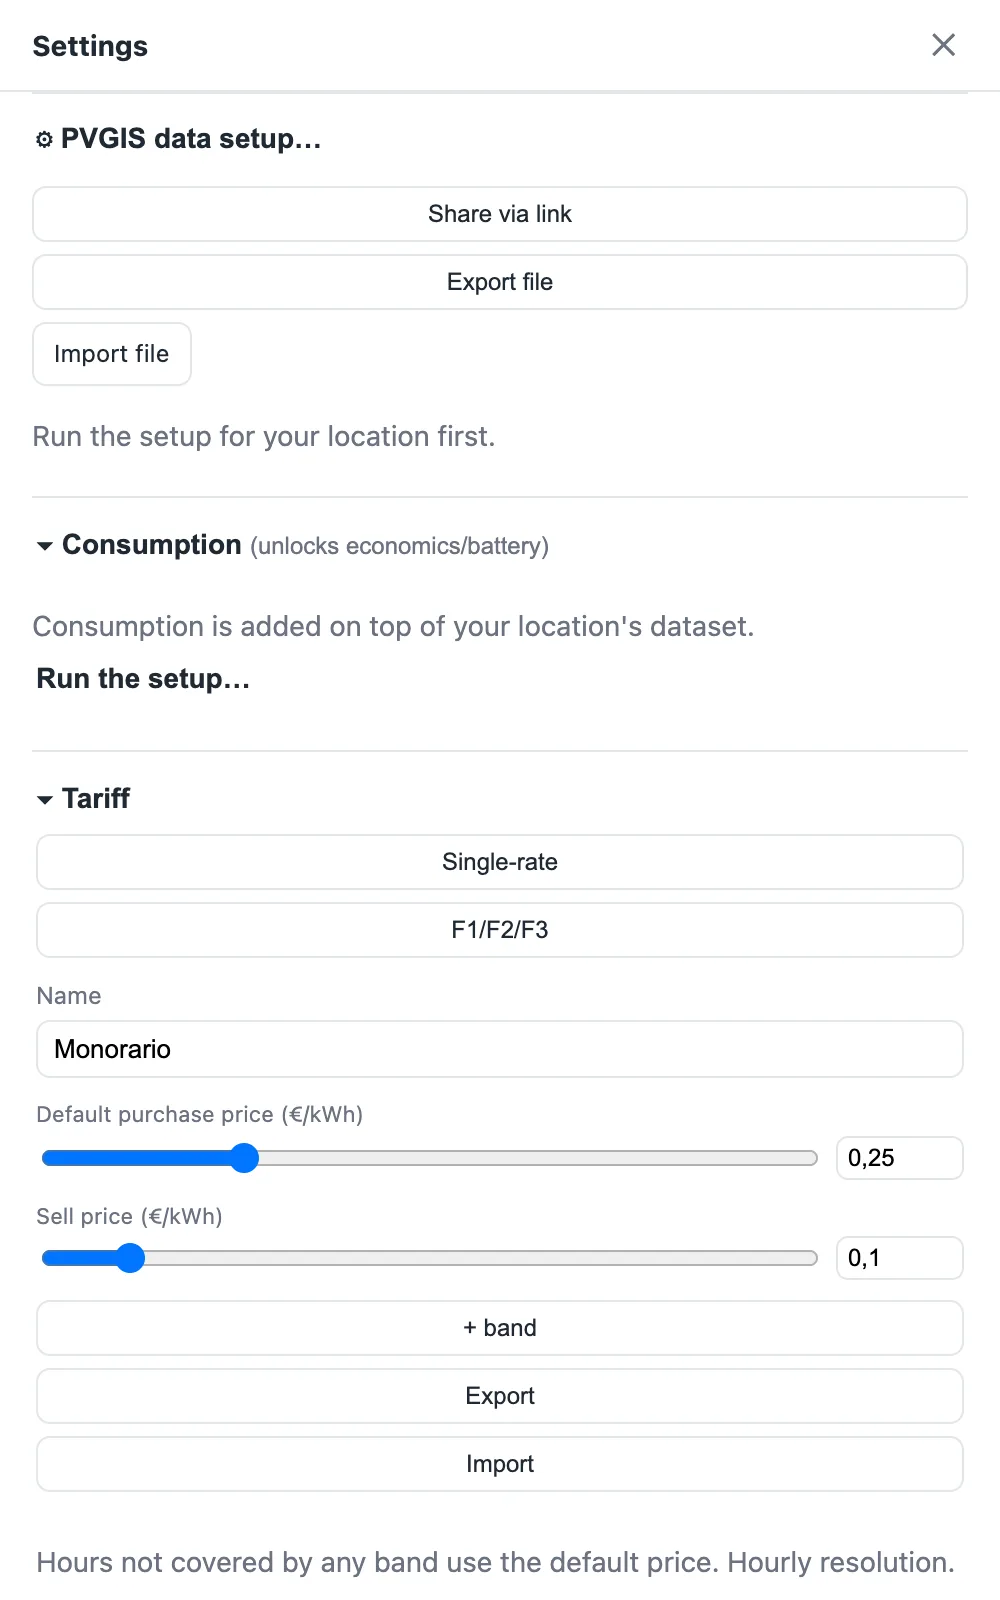
Upload your smart-meter export for a real load curve (Italy's e-distribuzione CSV is supported out of the box), or start from monthly bills or a guided estimate. Then your tariff: flat or time-of-use.
Files are read directly in your browser: nothing is uploaded to or stored on our servers.
The verdict.
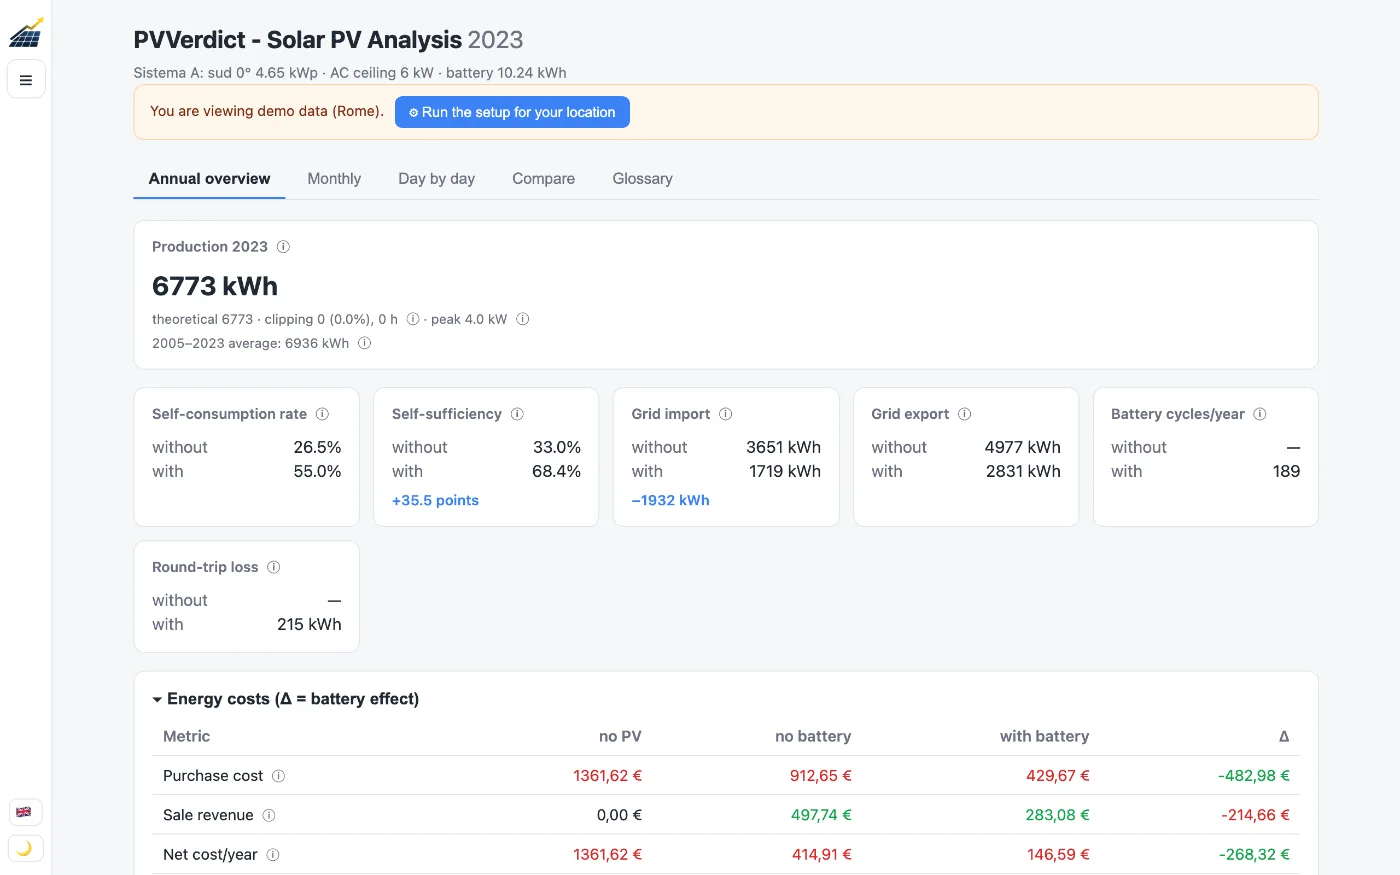
Payback years, annual savings, self-consumption and self-sufficiency. Plus the side-by-side comparison: with battery versus without, to see whether the extra thousands pay for themselves.
What you actually see, numbers in hand
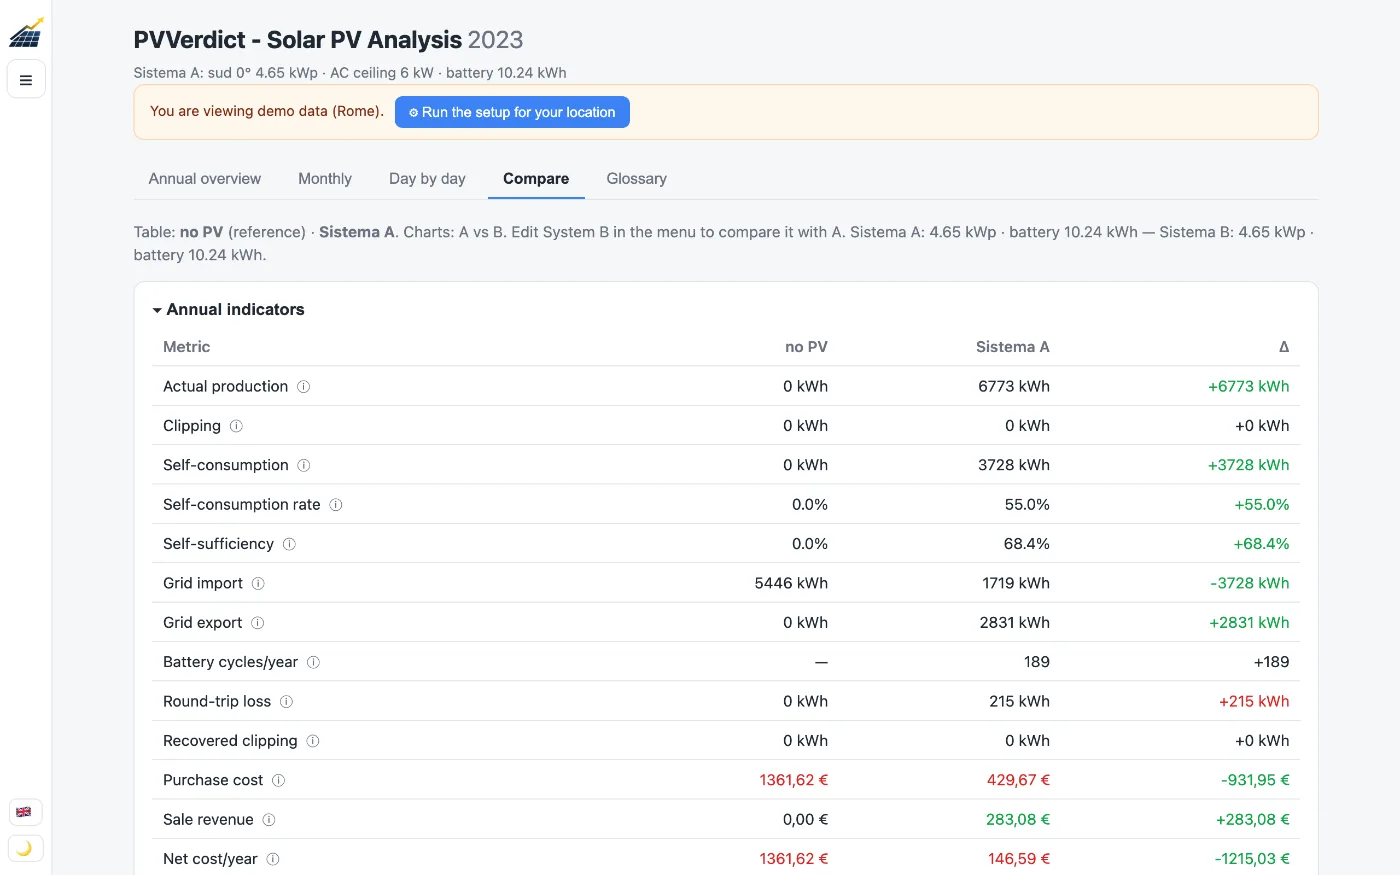
Battery: yes or no, side by side.
Two systems on one screen — same roof, same consumption, with and without storage. Cycles per year, energy shifted, payback difference: the most expensive decision becomes a readable comparison.
Your year, hour by hour.
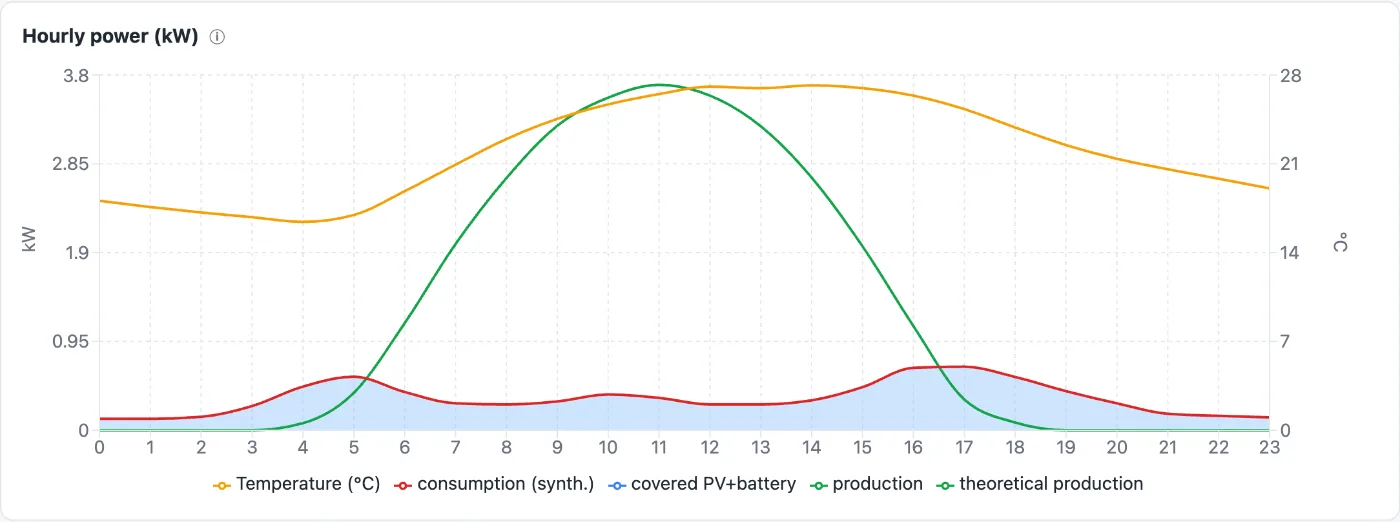
Production, consumption and temperature on the daily chart: see when you produce, when you consume, and how much they overlap. This is where monthly averages stop being enough.
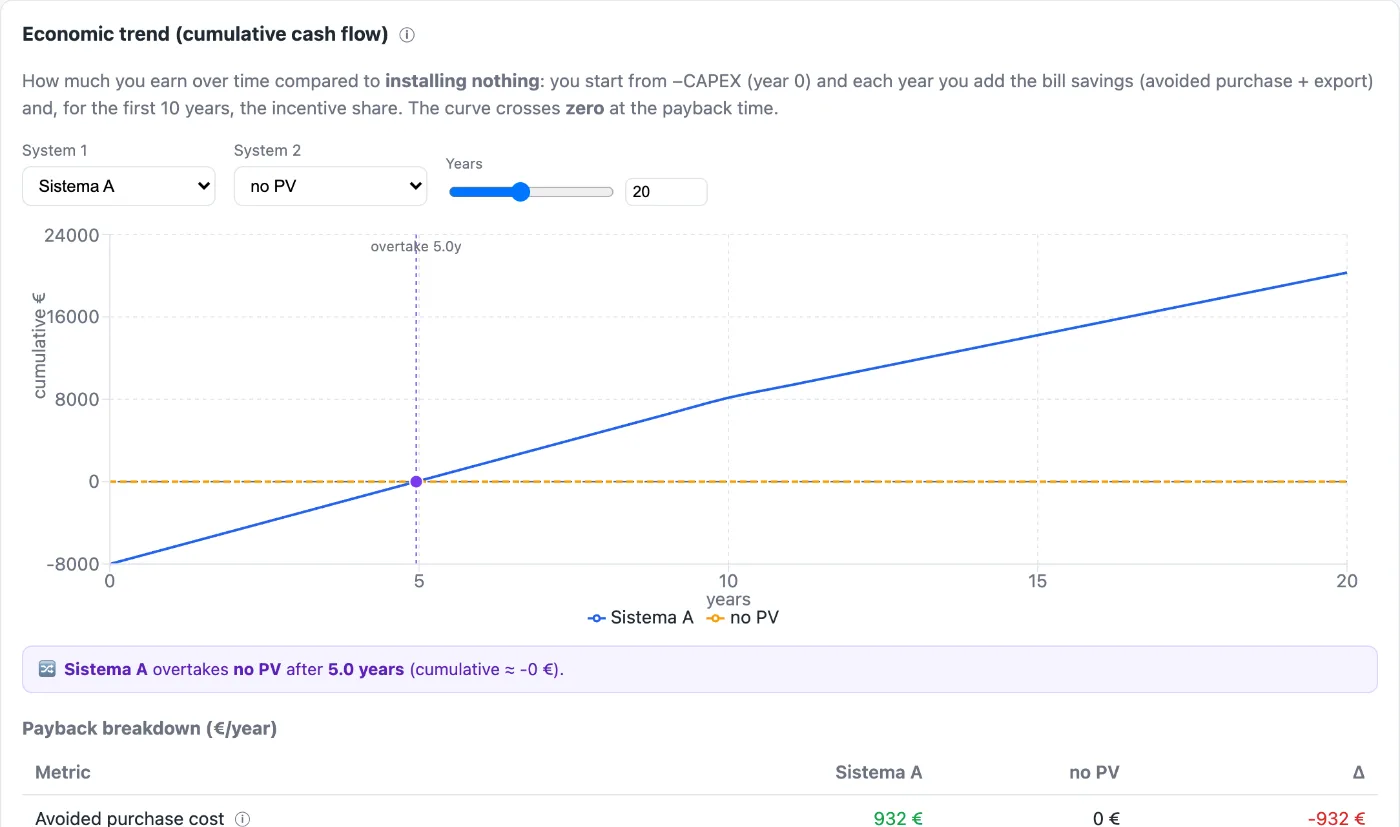
The economics, year by year.
The capital curve: investment, incentives, cumulative savings — and the year the line crosses zero.
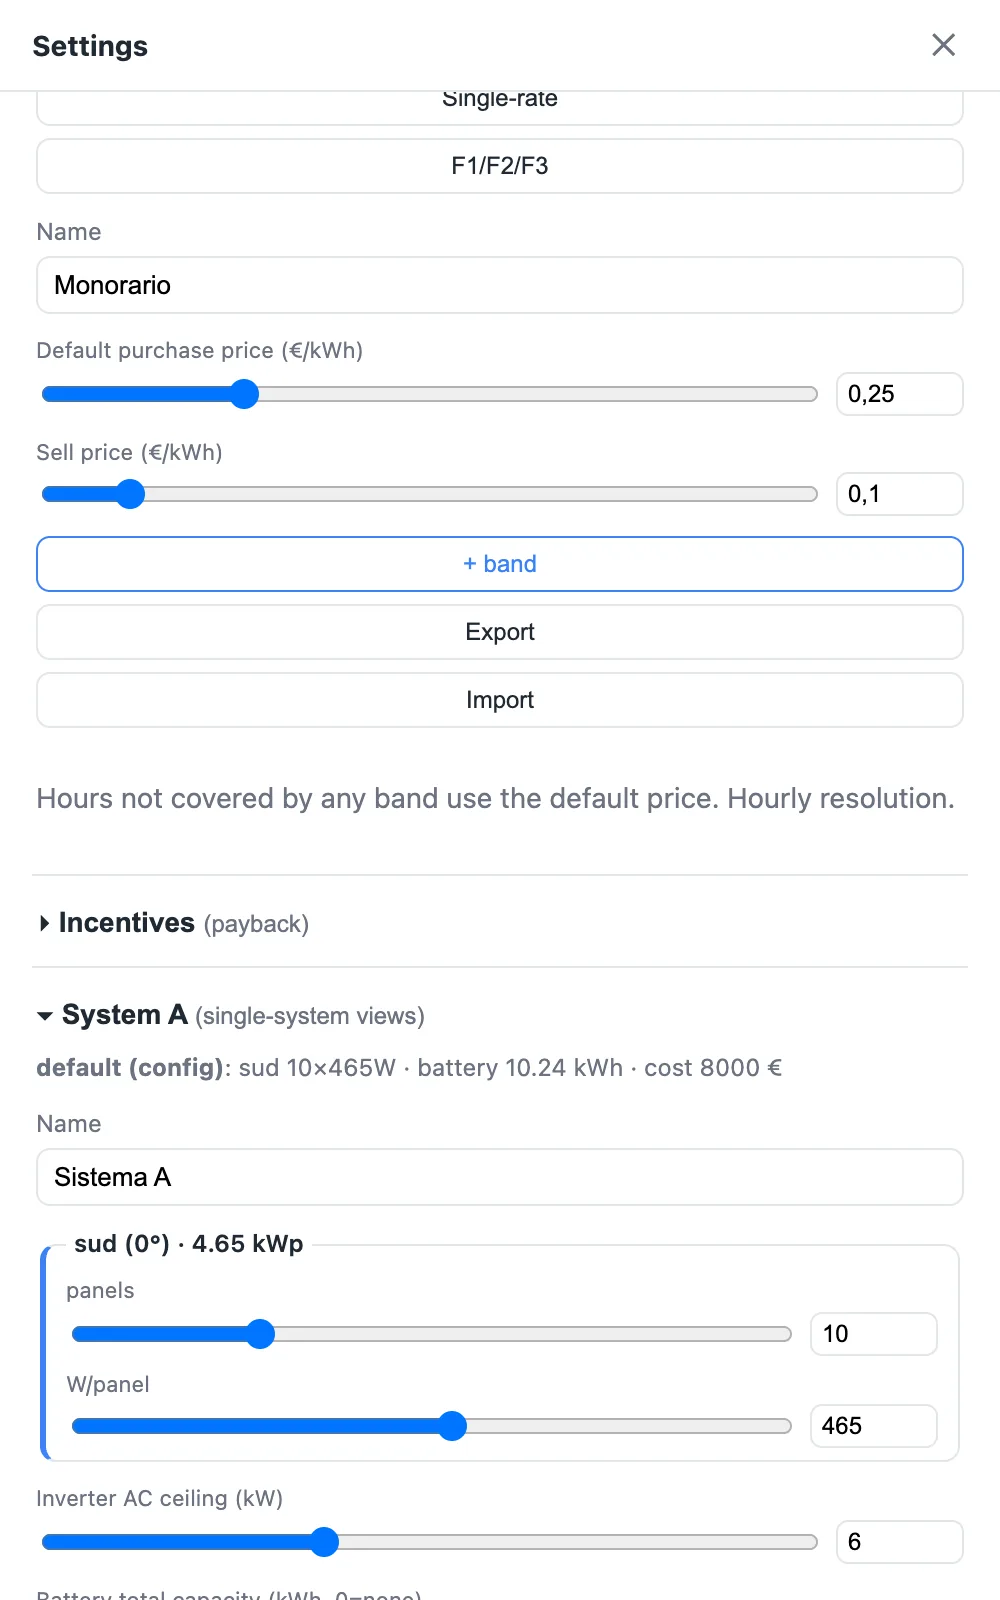
Your rates, your prices.
Time-of-use or flat: every kWh is valued at the price of the hour you use or export it.
What we don't model (and why we tell you)
Every estimate has boundaries. These are ours:
Panel and battery degradation. Modules lose a fraction of a percent per year, batteries lose capacity with every cycle. We don't simulate it: over a 5–7 year payback it moves little, and we prefer a simple, verifiable model to one full of invisible parameters.
Discounting (NPV). Future savings are worth less than today's. Our cashflow is nominal: easier to read and to check, less “financially elegant”.
Future energy prices. Nobody knows them. We use your current tariff, held constant: if prices rise, your payback will be faster than what we show.
Your specific tax situation. Deductions and incentives vary by country, situation and year: you enter the amount you're entitled to, the tool doesn't guess it.
These are deliberate simplifications, all documented. We'd rather tell you here than have you find out later — it's also why the code is open: you can check how we calculate, line by line.
Your data stays yours. And you can read the code.
Everything in the browser. The simulation runs on your device: your consumption, bills and CSV files never leave the browser. The only request that goes out is for climate data: it passes through our technical proxy (needed to talk to PVGIS) and contains only coordinates and system parameters — never your consumption, never anything that identifies you. The proxy stores nothing: it forwards and forgets.
No account. No sign-up, no email, no newsletter. Open and calculate.
Open source (AGPL-3.0). Every formula is public and documented. If you think a calculation is wrong, you can verify it — and tell us.
Public European data. Production estimates come from PVGIS, the scientific service of the European Commission's Joint Research Centre. We don't invent numbers: we take them from the people who measure them.
Frequently asked questions
Is a battery worth adding to solar panels?
It depends on how much you produce while you're out and how much you consume after sunset: a battery only pays for itself if it shifts enough kWh from day to evening. With low evening consumption it can lengthen your payback instead of shortening it. It's a calculation, not an opinion: PVVerdict compares the same system with and without storage, hour by hour, and shows you the difference in years and euros.
How many years does it take for solar to pay for itself?
In southern Europe, typically 4 to 9 years — a wide range precisely because it depends on location, self-consumption, tariff and incentives. Any single number you read online says little about your roof. The tool computes your cashflow year by year, with your system cost and your incentives.
How much does a solar system actually produce in my area?
The same installed power can yield 30% more or less across a single country, and roof orientation and tilt matter too. PVVerdict uses hourly historical data from PVGIS (the European Commission's scientific service) for your exact position: not a national average — your point on the map.
Can I use my smart-meter data?
Yes. Upload your distributor's consumption export (Italy's e-distribuzione quarter-hourly CSV is supported natively; generic CSV formats work too) and the simulation runs on your real load curve instead of a standard profile. The file is read directly in your browser — it never reaches any server.
How reliable are the estimates?
They're estimates, and we say so plainly: we use years of measured climate data, your consumption and your tariff, but we don't model component degradation or future energy prices. Every assumption is documented and the code is open source: you can check how we calculate, formula by formula.
Is solar worth it even without a battery?
Often yes: panels alone usually have the fastest payback, because they cost less and direct self-consumption is the most efficient saving. The battery is a second investment, to be judged on its own — and that's exactly the comparison the tool puts in front of you.
Where does my consumption data end up?
Nowhere: it stays in your browser. No account, no upload, no tracking of your consumption. The only outgoing request is for the climate data of your location. The project is open source precisely so you don't have to take our word for it.
Ready for the real numbers?
Two minutes of setup, no account. The verdict on your roof — payback, savings, battery yes or no — computed on your data, not on an average.
Try the tool nowOpens with the Rome example: explore, then run the setup for your own location.